Six Service Lines & Nine Engagement Types for early-stage founders
Six Service Lines & Nine Engagement Types for early-stage founders
Market assessment, validation research, go-to-market, capital strategy, governance and decision systems. Every engagement scoped to one dated decision.
Every engagement closes one dated decision
We don't sell hours and we don't sell decks. An engagement is scoped around a single decision you have to make by a particular date — enter this market or don't, fund this build or don't, sign this channel or walk away.
That constraint is what makes the work scopeable, and it's what makes it worth buying. You know what you're getting, when you're getting it, and what you'll be able to decide once you have it.


Our Method:
How the work is built
Every claim traces to a named source.Anything unsourced gets flagged as unsourced, not written confidently and hoped over.
Every gap gets an owner and a date.Ordered by lead time and by what it blocks, so the long poles start first.
Kill and pivot thresholds are agreed before the evidence arrives.Not after, when the number is inconvenient and everyone has an argument for why this case is different.
The output is a decision.One page, one recommendation, one owner, one date — then retired into a log, so the reasoning survives the meeting that produced it.
Case Study— Regulated software GTM
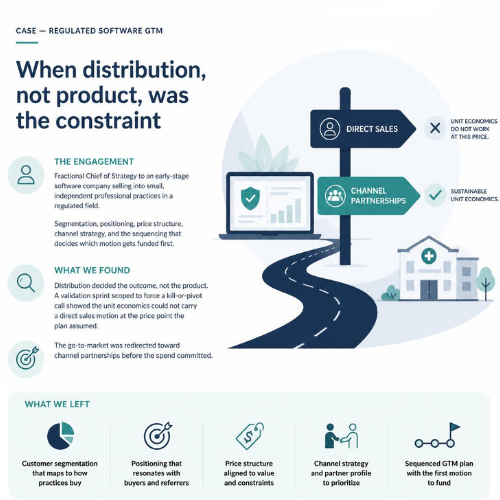
When distribution, not product, was the constraint
The engagement. Fractional Chief of Strategy to an early-stage software company selling into small, independent professional practices in a regulated field. Segmentation, positioning, price structure, channel strategy, and the sequencing that decides which motion gets funded first.
What we found. Distribution decided the outcome, not the product. A validation sprint scoped to force a kill-or-pivot call showed the unit economics could not carry a direct sales motion at the price point the plan assumed. The go-to-market was redirected toward channel partnerships before the spend committed.
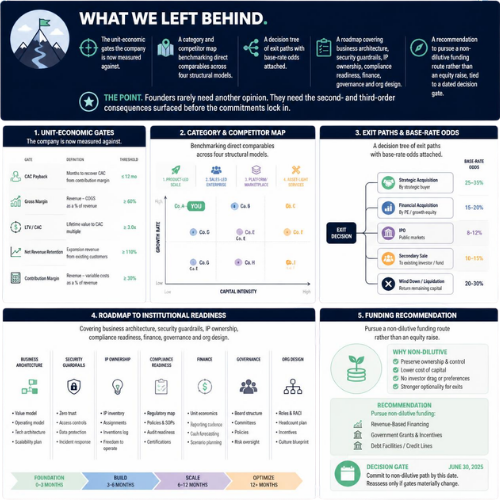
What we left behind. The unit-economic gates the company is now measured against. A category and competitor map benchmarking direct comparable across four structural models. A decision tree of exit paths with base-rate odds attached. A roadmap covering business architecture, security guardrails, IP ownership, compliance readiness, finance, governance and org design. And a recommendation to pursue a non-dilutive funding route rather than an equity raise, tied to a dated decision gate.
The point. Founders rarely need another opinion. They need the second- and third-order consequences surfaced before the commitments lock in.
Case Study 2— expansion siting
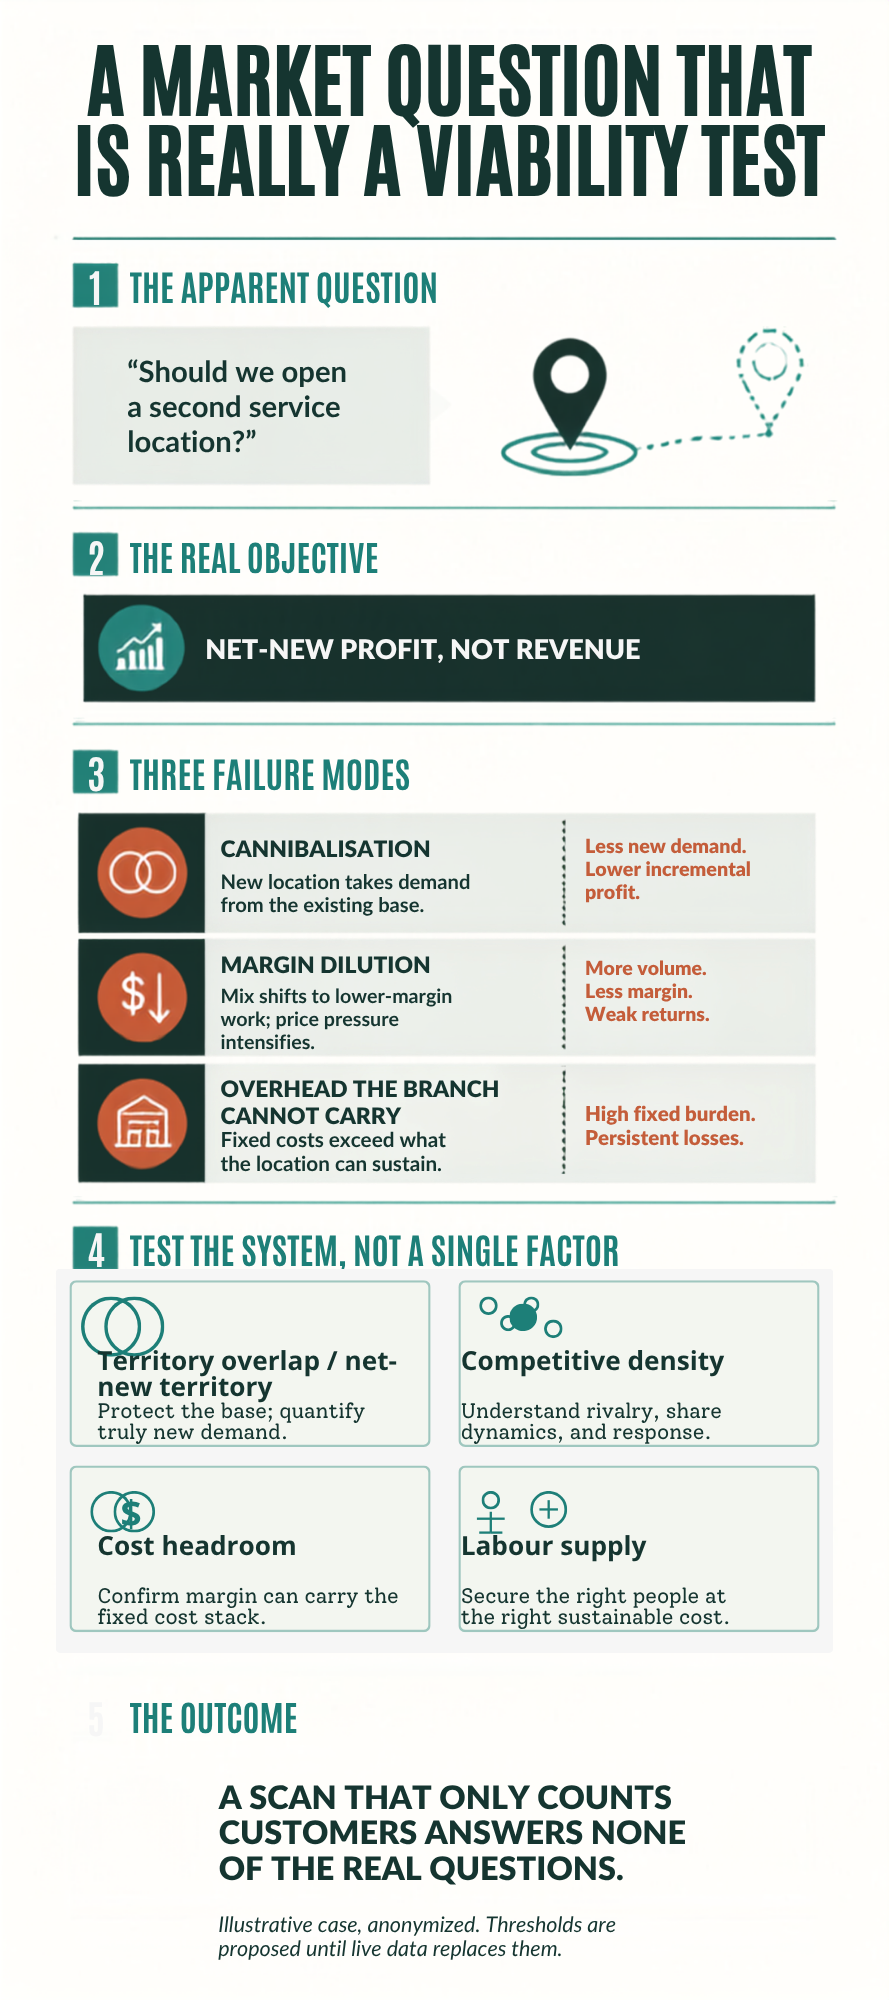
A cost ceiling, when nobody knew the costs yet
The engagement. A regional home-services contractor wanted to extend its service radius by opening a second location. The question looked like a marketing question. It wasn't.
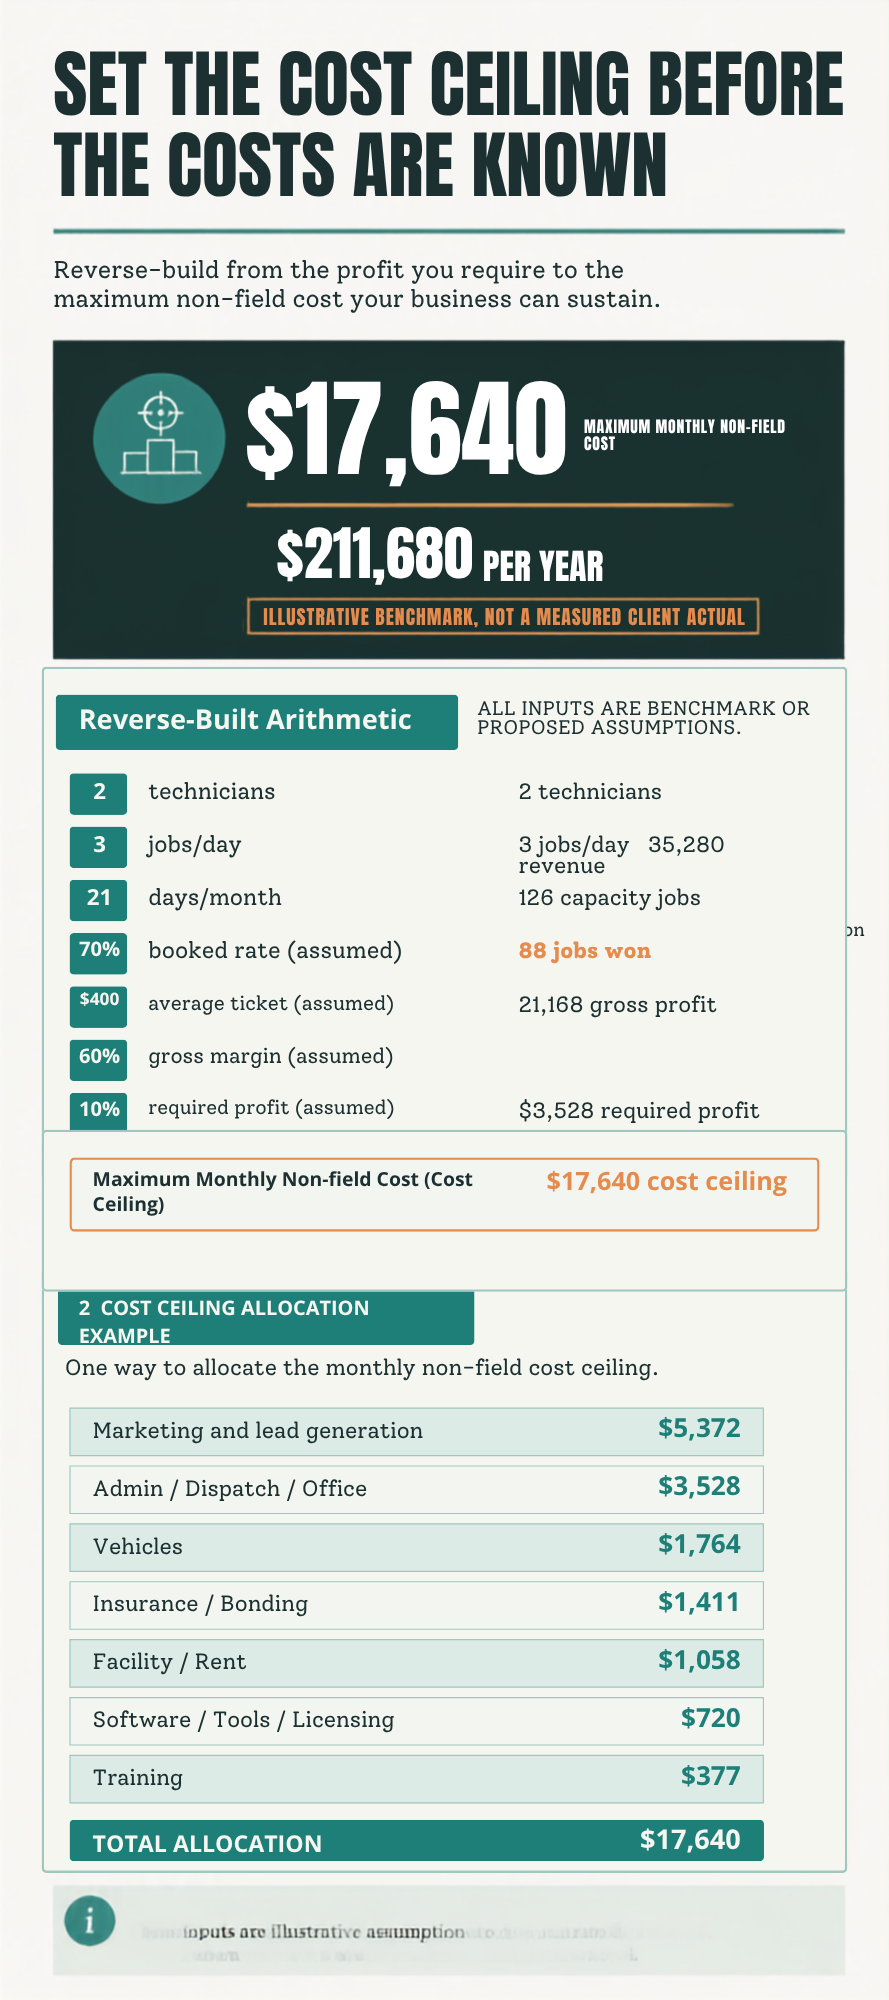
The problem. Intake was thin — the client didn't yet know what the branch would cost to run, which is the usual state of things at the moment the decision gets made. So we solved it the other way round.
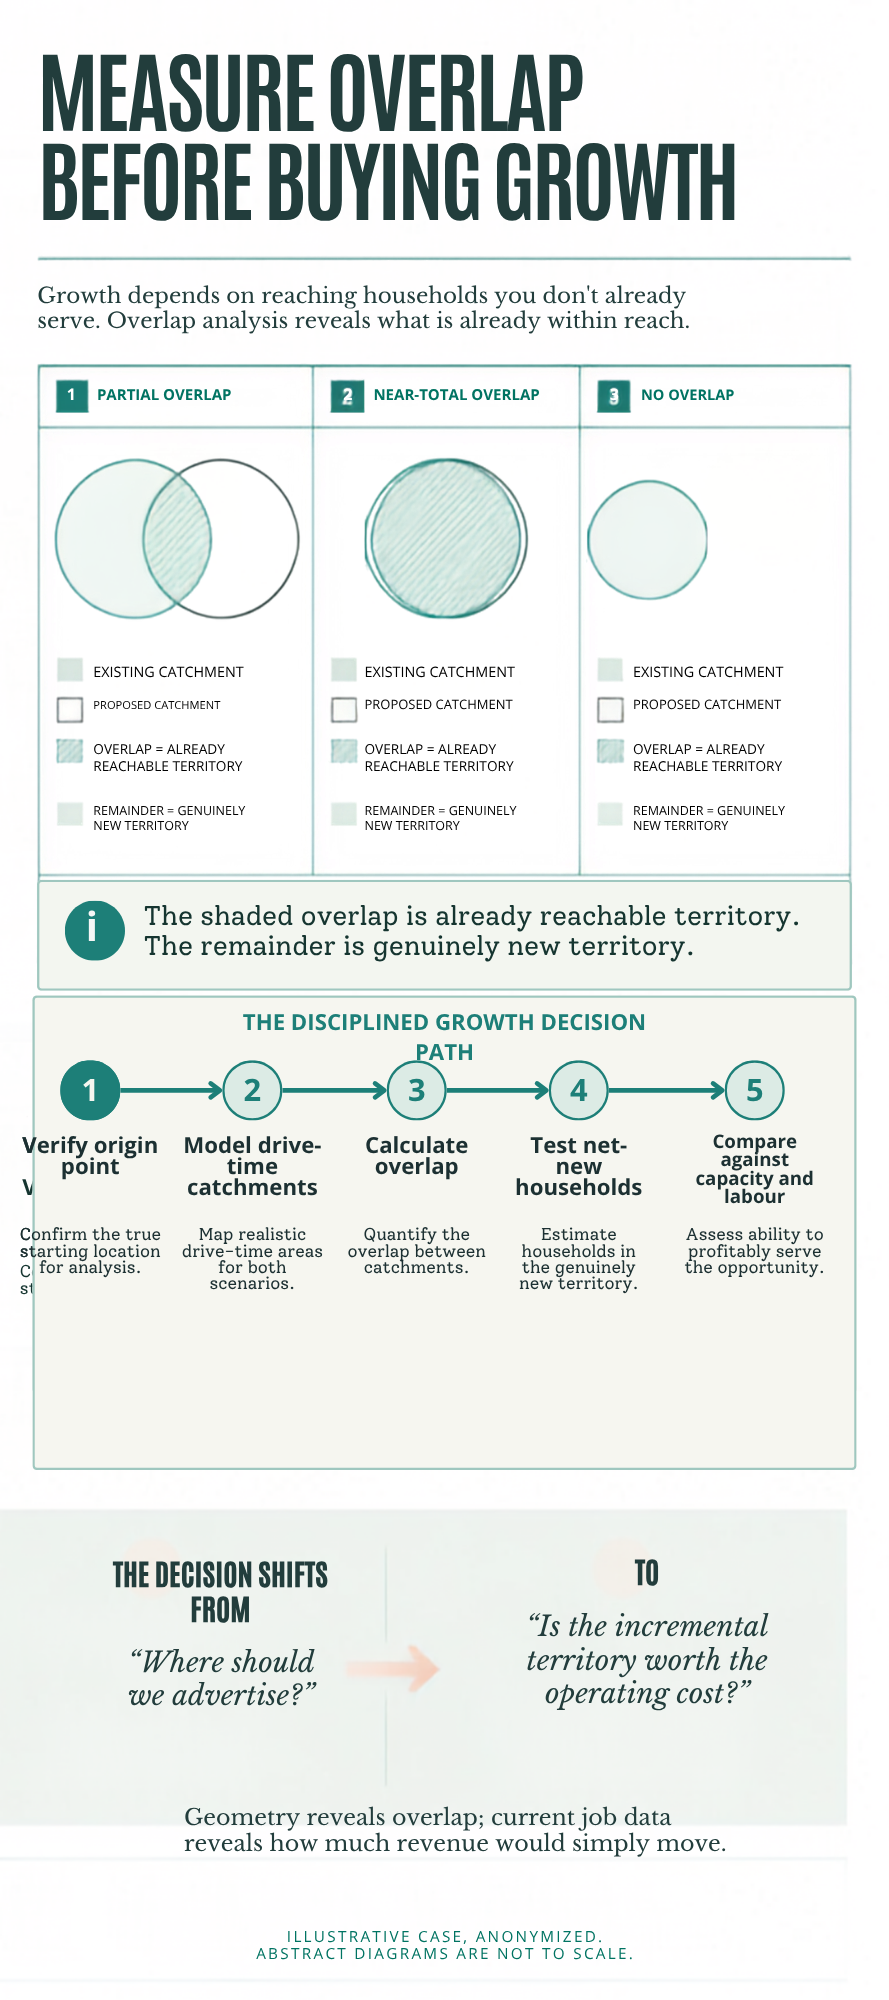
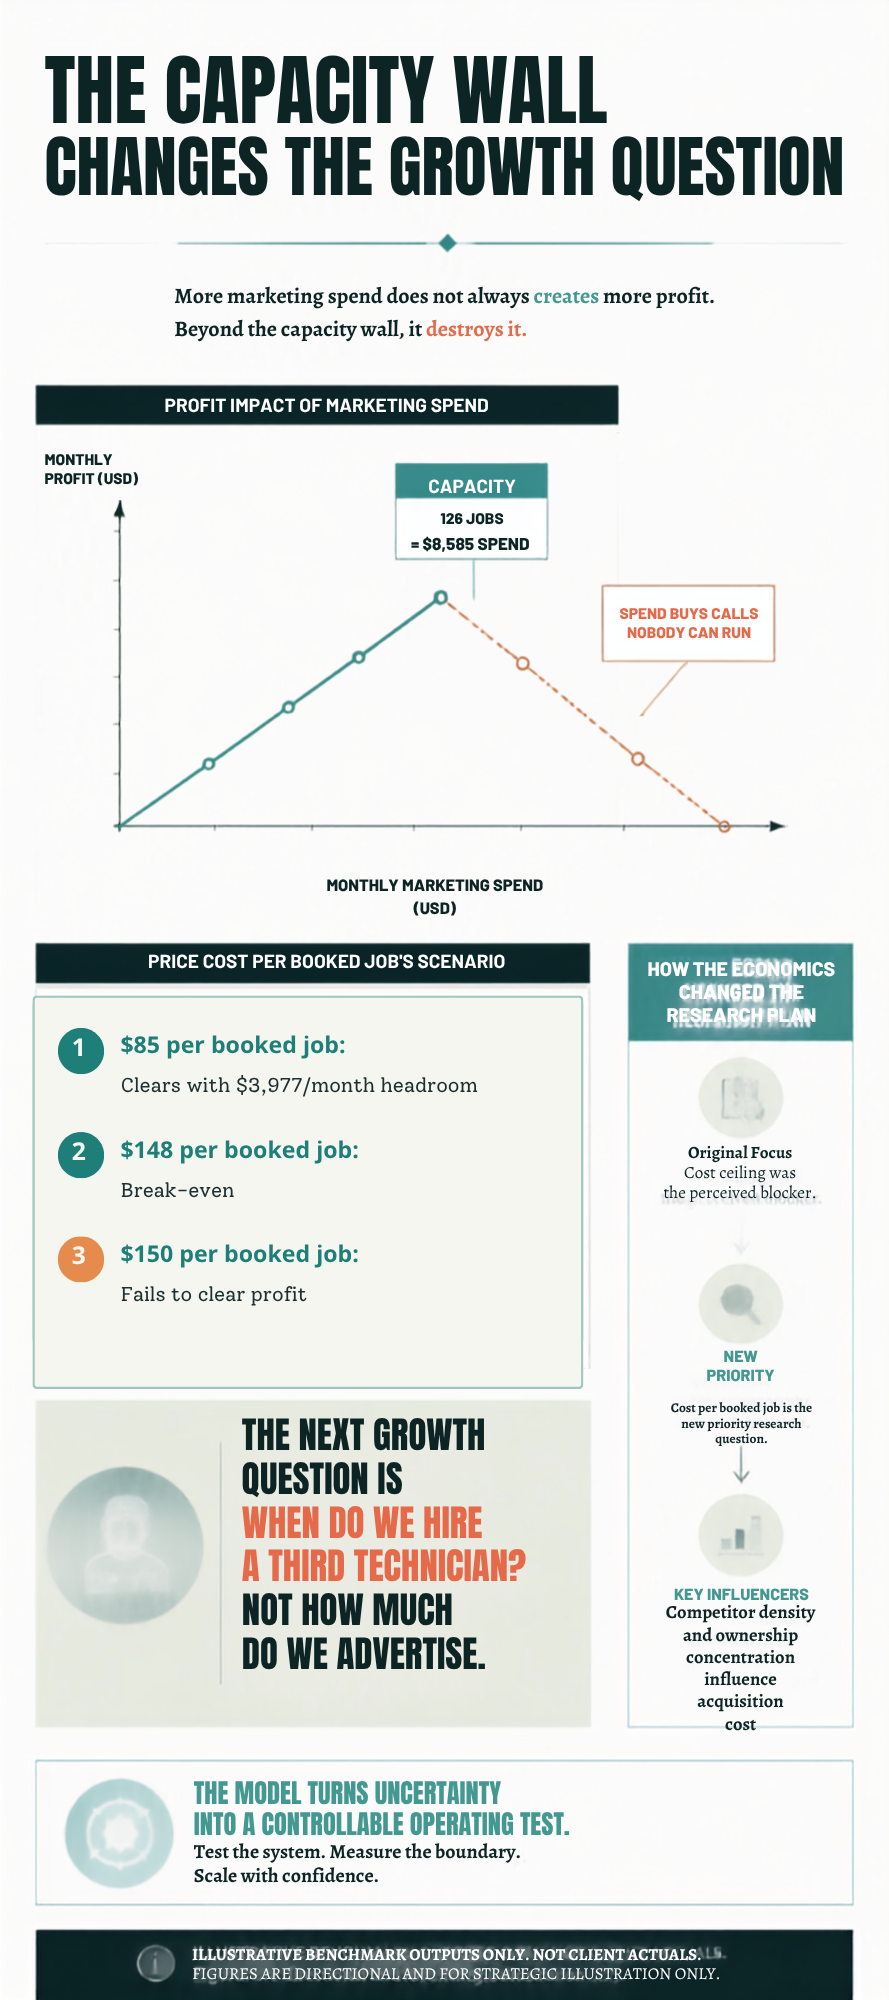
What we built. A cost ceiling: the most the branch can spend per month on everything that isn't field labour and still clear a real profit. Built from competitor density, drive-time and overlapping-service-area analysis, overhead assumptions and dispatch job estimates. The client checks actuals against the ceiling instead of guessing at a forecast.
What it changed. The geospatial work surfaced a question nobody had asked — how much of the new radius overlapped territory they already served. That reframed the decision from "where do we advertise" to "is the juice worth the squeeze", and produced a follow-up engagement.
What We Don’t Do
Being straight about this saves everybody a call.
Regulatory or legal counsel. We identify where you need it and what it has to cover. We don't provide it.
Grant writing. We architect the application and the evidence it has to carry; a specialist writer writes it.
Engineering delivery. Our own tooling is internal. We don't build your product.
Paid campaign management and event sponsorship packaging.
Clinical, actuarial or security certification opinions. SOC 2 readiness gets scoped and gated; the audit signature is someone else's.